
Instant Explainability
Go beyond what happened to why it happened.
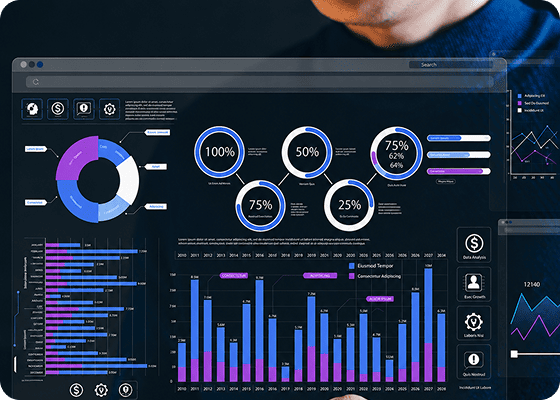
Dashboard Lens surfaces correlations, trends, and causal insights in plain language — turning dashboards into dynamic narratives that every team can understand and act on.

dashboard lens
Transform your static dashboards into a conversational intelligence partner that explains why performance shifts and suggests what to do next.
Most BI Tools show what happened, not why and insights stay buried inside siloed dashboards.
Your BI dashboards tell you what happened — not why it happened. Static charts stop at surface metrics. Without automated causal discovery, your teams spend hours digging through data to explain performance shifts and trends.

Critical insights stay buried within dashboards and silos. Each new question requires manual queries or analyst support slowing response times, limiting cross-functional visibility, and preventing leaders from acting on insights when they matter most.

Manual analysis slows business momentum. When every new question turns into a data request, decision latency compounds. Teams lose agility, opportunities fade, and “data-driven” becomes “data-delayed.”

Dashboard Lens uses an agentic, governed architecture that combines flow-based reasoning, retrieval, and robust execution controls, ensuring outputs are accurate, repeatable, and explainable.

Expert-defined logic flows verified computationally before generation — reducing hallucinations

Retrieve → Reason → Respond for trust-indexed, domain-validated insights

Every query yields the same interpretation — no drift, no randomness

Python ensures precision; LLMs explain and summarize

Context, Human oversight, Auditability, Security, Interpretability, and Scalability ensure full enterprise compliance
Go beyond what happened to why it happened.
Dashboard Lens surfaces correlations, trends, and causal insights in plain language — turning dashboards into dynamic narratives that every team can understand and act on.

Dashboard Lens integrates seamlessly with your upstream data warehouse and downstream BI tools, ensuring every insight is traceable, governed, and audit-ready.
Built for enterprise compliance, it maintains consistent KPIs, lineage, and data security across the analytics ecosystem.

Empower business users to explore, question, and act — without waiting on analysts.
Natural-language queries deliver real-time, explainable summaries and next-best actions directly within your BI environment, accelerating time to decision.
